⚡ The Bullion Sell-Off: Spot Gold Plunges Over 3% in Sudden Liquidation
Global precious metal markets witnessed an aggressive and sudden unwinding today as spot gold (XAU/USD) plunged more than 3.1%, falling through key technical support lines to mark its lowest trading level since August 5, 2026.
The steep retreat, which saw bullion shed more than $75 an ounce during peak European and New York trading sessions, caught institutional traders off guard following weeks of relative price consolidation near historic highs. The sharp decline was accompanied by elevated trading volume across COMEX futures contracts and the London Bullion Market Association (LBMA) over-the-counter clearing networks.
Market participants pointed to a potent macro trifecta behind the sudden sell-off: surging global crude oil prices, a renewed flare-up in medium-term inflation expectations, and a sharp repricing of central bank monetary policy expectations led by the U.S. Federal Reserve.
🖼️ Wall Street Commodities Trading Floor: Spot Gold Liquidation

🛢️ Catalyst 1: Surging Crude Oil Prices Reignite the Inflation Dilemma
The primary spark for today's market reassessment originated in global energy markets. International benchmark Brent crude surged over 4.1% to trade above $87.50 a barrel, while West Texas Intermediate (WTI) climbed past $83.80.
The sudden rally in crude oil, sparked by escalating transit risks through Middle Eastern maritime corridors and tightening supply quotas from major producers, has fundamentally altered the macroeconomic narrative that had supported gold over recent quarters:
- Energy Inflation Resurgence: Higher crude prices feed directly into headline consumer price index (CPI) and producer price index (PPI) prints, driving transport, manufacturing, and agricultural costs higher.
- Inflation Breakeven Spikes: Five-year and ten-year inflation breakeven rates climbed aggressively in bond markets, reflecting investor concern that the "last mile" of disinflation has stalled.
- The Policy Constraint: While gold is historically considered an inflation hedge over multi-decade cycles, in the short-to-intermediate term, persistent inflation forces central banks to delay or curtail rate cuts, which is decisively bearish for non-yielding assets.
"Markets had comfortably priced in an uninterrupted glide path toward monetary easing. Today's surge in energy benchmarks shattered that complacency. When oil pushes toward $90, the Federal Reserve simply cannot afford to commit to aggressive rate cuts. That dynamic pulls the rug straight out from under gold." — Chief Commodities Strategist, New York Investment Bank
🏛️ Catalyst 2: Monetary Policy Repricing — The "Higher-for-Longer" Reality Returns
The direct transmission mechanism between rising energy costs and the gold crash is the aggressive repricing of sovereign interest rate futures.
Throughout late summer, traders had positioned for an aggressive sequence of 25 and 50 basis point interest rate reductions from the U.S. Federal Reserve, the European Central Bank (ECB), and the Bank of England. Today's inflation fears forced a sharp reversal in those bets:
- 1Fed Funds Futures Reversal: Odds of consecutive rate cuts through the fourth quarter plummeted, with swaps markets pricing in a prolonged plateau in benchmark lending rates.
- 2U.S. 10-Year Treasury Yield Surge: Benchmark 10-year Treasury yields jumped by 14 basis points to touch 4.38%, their highest levels since early August. Two-year Treasury yields, which closely mirror policy expectations, rose similarly.
- 3The Yield Penalty on Bullion: Because physical gold pays no coupon, dividend, or nominal yield, its relative appeal deteriorates rapidly when real risk-free yields on government paper rise. Investors face an escalating opportunity cost by holding bullion instead of cash or high-yielding sovereign bonds.
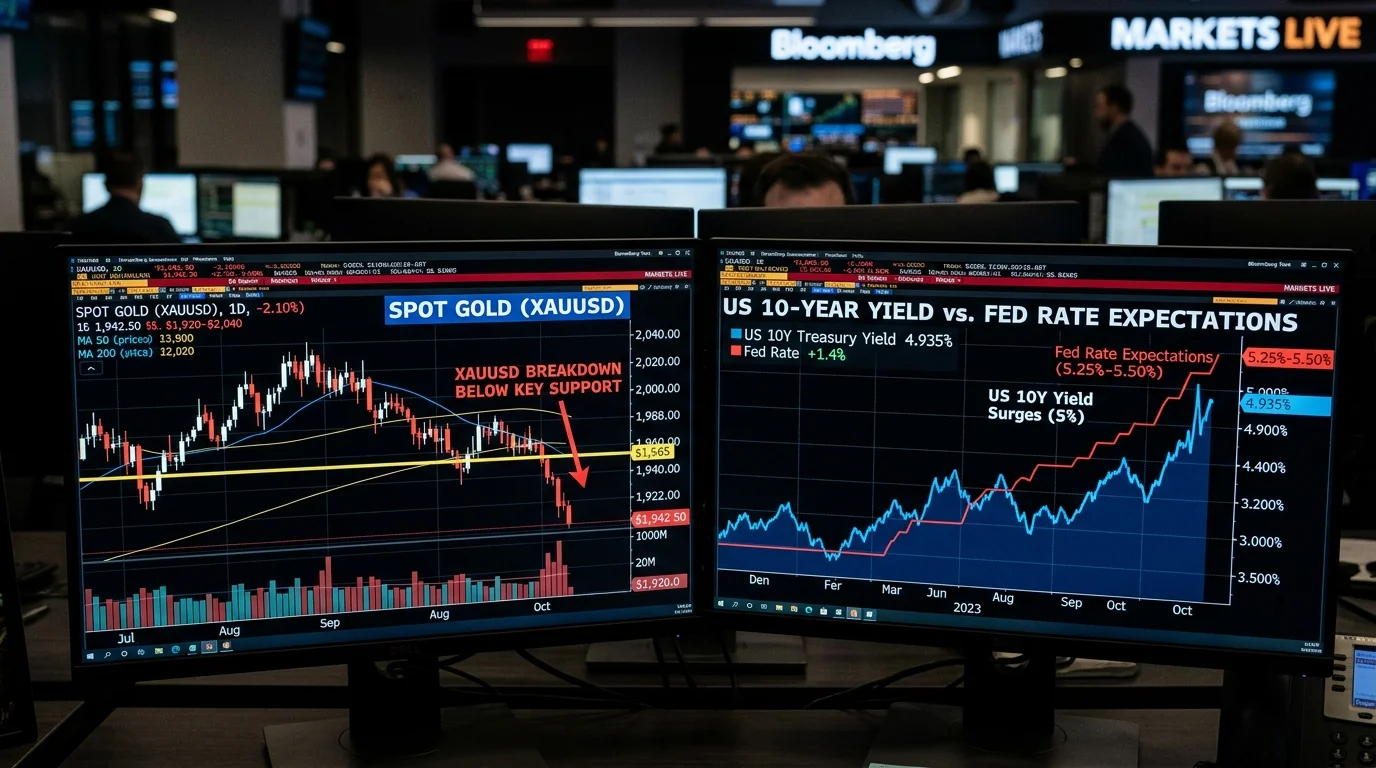
🖼️ Macroeconomics & Technical Breakdown: Treasury Yields vs. Spot Gold
💵 Catalyst 3: The Resilient Greenback (DXY) Adds Crushing Pressure
Compounding the pressure on precious metals was a broad rally in the U.S. Dollar Index (DXY), which jumped 0.76% to reach 104.92.
Because gold is universally denominated in U.S. dollars on international exchanges, a strengthening dollar creates an immediate mechanical drag on demand:
- Foreign Buyer Friction: For institutional funds and physical consumers holding euros, British pounds, Japanese yen, or Indian rupees, a stronger dollar makes gold substantially more expensive in local currency terms, curtailing import appetite.
- Systematic Trend-Following Liquidations: Algorithmic commodity trading advisors (CTAs) and quantitative funds hold automated triggers tied to DXY-XAU inverse correlation metrics. As the dollar broke above resistance, systematic sell orders flooded the COMEX order books.
📊 Cross-Asset Market Impact Matrix: Gold Crash vs. Key Assets
Today's market action triggered sharp divergences across asset classes. Below is the multi-asset performance snapshot during the session:
| Asset Class / Instrument | Ticker / Benchmark | Day Change (%) | Net Change | Key Driver / Catalysts |
|---|---|---|---|---|
| Spot Gold (Bullion) | XAU/USD | -3.15% | -$78.20/oz | Lowest since Aug 5; yield surge & CTA liquidation |
| Spot Silver | XAG/USD | -4.65% | -$1.42/oz | High-beta precious metal tracking gold lower |
| Brent Crude Oil | LCOc1 | +4.15% | +$3.52/bbl | Geopolitical supply risks & tight inventories |
| WTI Crude Oil | CLc1 | +4.48% | +$3.61/bbl | Refined product demand & refinery maintenance |
| U.S. Dollar Index | DXY | +0.76% | +0.79 pts | Repriced Fed rate cuts & safe-haven flows |
| U.S. 10-Year Treasury Yield | US10Y | +3.35% | +14.2 bps | Re-accelerating inflation expectations |
| U.S. 2-Year Treasury Yield | US02Y | +2.45% | +10.8 bps | Hawkish central bank policy repricing |
| S&P 500 Index | SPX | -0.85% | -46.2 pts | Higher discount rate pressure on growth equities |
🏦 The Institutional Divide: Central Bank Buying vs. Paper Market Liquidations
While paper derivatives and leveraged futures experienced heavy selling, analysts highlight a profound structural divergence beneath the surface:
1. Western ETF and Hedge Fund Outflows
Exchange-traded funds (ETFs) backed by physical gold registered significant redemptions over recent sessions. Retail and institutional wealth managers in North America and Western Europe have rotated capital toward money market funds yielding over 4.5% to 5.0%, treating bullion as an expensive funding source.
2. Sovereign Central Bank Accumulation
Conversely, non-Western central banks continue to display strategic physical accumulation. Official institutions—led by the People's Bank of China (PBoC), the Reserve Bank of India (RBI), and the Central Bank of the Republic of Turkey—have maintained multi-year diversification initiatives away from G7 reserve currencies.
Commodity strategists note that while speculative paper traders can push prices down sharply in the short term, sovereign bids have consistently established hard floors under gold during previous pullbacks in 2024–2026.
📉 Technical Analysis: Crucial Support Levels After the August 5 Low Retest
From a technical chart perspective, today's drop marks a decisive breach of recent range-bound consolidation:
- 50-Day Moving Average Broken: Spot gold pierced below its 50-day simple moving average (SMA) with substantial expansion in volume, turning short-term momentum indicators firmly negative.
- The August 5 Retest: Prices tested the critical $2,365 – $2,380 zone, which served as the dramatic intraday bottom during the global market volatility of August 5. A sustained daily close below this support opens the door for a deeper structural correction toward the 200-day moving average near $2,310.
- RSI Divergence: The daily Relative Strength Index (RSI) slid from 56 down to 31, rapidly approaching oversold territory. Technical analysts note that while the sell-off is stretched, a stabilization in crude oil and bond yields will be required before any durable relief bounce can take root.
🔮 What to Watch Next: The Road Ahead for Precious Metals
Market strategists outline three pivotal catalysts that will dictate whether gold continues its slide or establishes a base:
- 1Upcoming Energy Inventory and OPEC+ Statements: Any cooling in crude oil prices will alleviate immediate inflation anxiety and remove upward pressure on bond yields.
- 2Upcoming Core PCE Inflation & Labor Data: The Federal Reserve's preferred inflation gauge will provide definitive proof whether sticky services inflation is accelerating or remaining within forecasted bands.
- 3Physical Buying Response in Asia: Historical market patterns suggest that sharp sell-offs in gold stimulate heightened consumer and retail jewelry buying across India, China, and the Gulf, potentially absorbing surplus paper selling.
❓ Frequently Asked Questions (FAQ)
Q1: Why did spot gold fall more than 3% today?
Answer: Spot gold tumbled over 3% due to a convergence of surging crude oil prices, reignited inflation concerns, and a hawkish repricing of central bank monetary policy. These factors caused U.S. Treasury yields and the U.S. Dollar Index (DXY) to spike, raising the opportunity cost of holding non-yielding bullion and triggering automated liquidation among institutional funds.
Q2: Why does higher crude oil negatively impact gold prices?
Answer: While gold is considered a long-term inflation hedge, sharp jumps in oil prices drive up short-term headline inflation expectations. This compels the Federal Reserve and other central banks to keep interest rates higher for longer or delay anticipated rate cuts. High interest rates boost bond yields and the dollar, which historically exerts strong downward pressure on gold.
Q3: What is the significance of gold hitting its lowest level since August 5?
Answer: August 5, 2026, was a day of intense global market turmoil and liquidity unwinding. Testing and breaking near those levels marks a significant technical inflection point, indicating that precious metals have broken through short-term moving average supports and are testing key institutional demand zones.
Q4: How do higher Treasury yields affect physical bullion?
Answer: Gold does not yield interest or pay dividends. When U.S. Treasury yields rise, investors can earn guaranteed, risk-free returns on government bonds. As a result, capital rotates out of precious metals and into fixed-income securities and cash instruments.
Q5: Are central banks likely to stop buying gold because of this drop?
Answer: Historically, central banks view price corrections as strategic accumulation opportunities. Sovereign reserve managers focus on multi-year geopolitical de-dollarization and reserve safety rather than short-term price fluctuations, often stepping in with physical purchases during major market pullbacks.
🔍 Trending Google Search Queries & Key Market Topics
For investors, traders, and analysts tracking this developing story, here are the most searched topics and market queries regarding today's bullion plunge:
- Why did Spot Gold fall more than 3% today? The drop was triggered by a rapid repricing of Federal Reserve monetary policy after surging crude oil (+4.15%) sparked renewed energy inflation fears and pushed 10-year Treasury yields to 4.38%.
- What is the significance of the August 5 low? August 5 marked a major global market liquidation low ($2,365/oz). Today's test of that floor represents a crucial technical battleground for institutional buyers and central bank reserve desks.
- How does higher crude oil hurt gold? Persistent energy price surges reduce the likelihood of near-term central bank rate cuts, maintaining high real bond yields and strengthening the U.S. dollar, both of which raise the opportunity cost of holding non-yielding bullion.
- Are central banks buying the dip? Sovereign institutions including the People's Bank of China (PBoC) and the Reserve Bank of India (RBI) have historically utilized paper derivative liquidations to accumulate physical reserves at discount valuations.
🏷️ Related SEO Keywords & Search Tags
Spot Gold Crash • XAU/USD Lowest Since Aug 5 • Higher Oil Inflation • Fed Monetary Policy Repricing • US 10Y Yield 4.38% • US Dollar Index DXY 104.9 • Silver Slump -4.6% • COMEX Futures Liquidation • PBoC Central Bank Gold Reserves • Commodities Market Analysis
Spot Gold Liquidation: Crude Shock, Inflation Fears & Yield Pressure
Live institutional tracking of the 3%+ drop in spot bullion (XAU/USD) to August 5 lows, fueled by a spike in Brent crude, resilient U.S. Dollar Index (DXY), and hawkish repricing of Federal Reserve policy.
Drops -$78.20/oz to lowest level since August 5, breaching the 50-day moving average.
Surging energy benchmarks reignite headline CPI fears and raise transport cost expectations.
Sharpest yield surge since early August; escalates opportunity cost of holding non-yielding bullion.
Greenback strength makes dollar-denominated bullion more costly for foreign currency buyers.